Discover and Engage With The Authentic Voice of Consumers
OSU - IRIS Innovation Club
Presenter: Natasha Pongonis
CEO, OYE! Business Intelligence and Co-Founder at Nativa Inc.
About Me
Natasha Pongonis is the Co-Owner of Nativa INC., a a multicultural communications agency with offices in Columbus, Ohio and Phoenix, Arizona; and is the CEO of OYE! Business Intelligence, a data analytics solution that provides demographic and psychographic insights into conversations online.
Natasha is a native of Argentina who has worked with companies in Europe, North and South America developing a strong sense of understanding the client’s needs and creating culturally relevant campaigns. Natasha started her Architectural studies while living in Belgium and continued her degree at the Catholic University of Cordoba, Argentina. She concluded her thesis studies in Architecture and Urban Planning at the University of Venice, Italy where she found her passion for marketing communication while working for a European firm. Being fluent in Spanish, English, French and Italian has always enabled her to reach out and connect with a diverse digital audience across the globe.
Natasha has been invited to speak at different conferences in the U.S. like SXSW in Austin, TX, the Open Data Science Conference in Boston, MA, Techstars Startup Week in Boulder, CO and The Society of Hispanic Professional
Engineers National Convention in Cleveland, OH among others. In 2017 Natasha was invited to the White House to participate in a round-table to discuss priorities for Latina business owners in America. Natasha received several awards recognizing her work as a female entrepreneur and innovator.
Natasha served on several Boards and was part of the 3rd cohort of the prestigious Stanford University’s Latino Entrepreneur Leaders Program and was invited by the U.S. State Department Civic Society 2.0 Women Entrepreneurship in the Americas Initiative to represent U.S. female entrepreneurs in Colombia.
“Understanding the impact of changes in population and how these dynamic forces affect not only consumer behavior, but the use of technology are key factors to ensure our client’s success.” Pongonis said in an interview for the Columbus CEO magazine.
Natasha lives in Columbus, Ohio with her husband and two children and she’s a proud holder of the “hockey mom” title.
Data Analytics
AI, Analytics & mL
84% of marketing organizations are implementing or expanding AI and machine learning
75% of enterprises using AI and machine learning enhance customer satisfaction by more than 10%
3 in 4 organizations implementing AI and machine learning increase sales and services by more than 10%
Artificial Intelligence enables computers to behave like humans. -Think of Siri on your phone ask a question and get an answer.
Machine Learning is the subset of Artificial Intelligence, based on algorithms identifies patterns from data sets. Rules are being pre-stablished for optimal behavior but also can adapt to changes in behavior. It can analyze massive data volumes.
- Unstructured data sources: social media, mobile data, blogs, public comments (articles, news), videos, etc.
- Structured data sources: consumer comments, work orders (names, address. zip codes), physician notes, etc.
Deep Learning are algorithms which use complex networks. Text-based searches, that can recognize certain patterns & characteristics like self-driving cars and robots.
These technologies will allow you to uncover actionable insights via data analytics, informs decisions., and drive more informed strategies.
Population, Data & Research
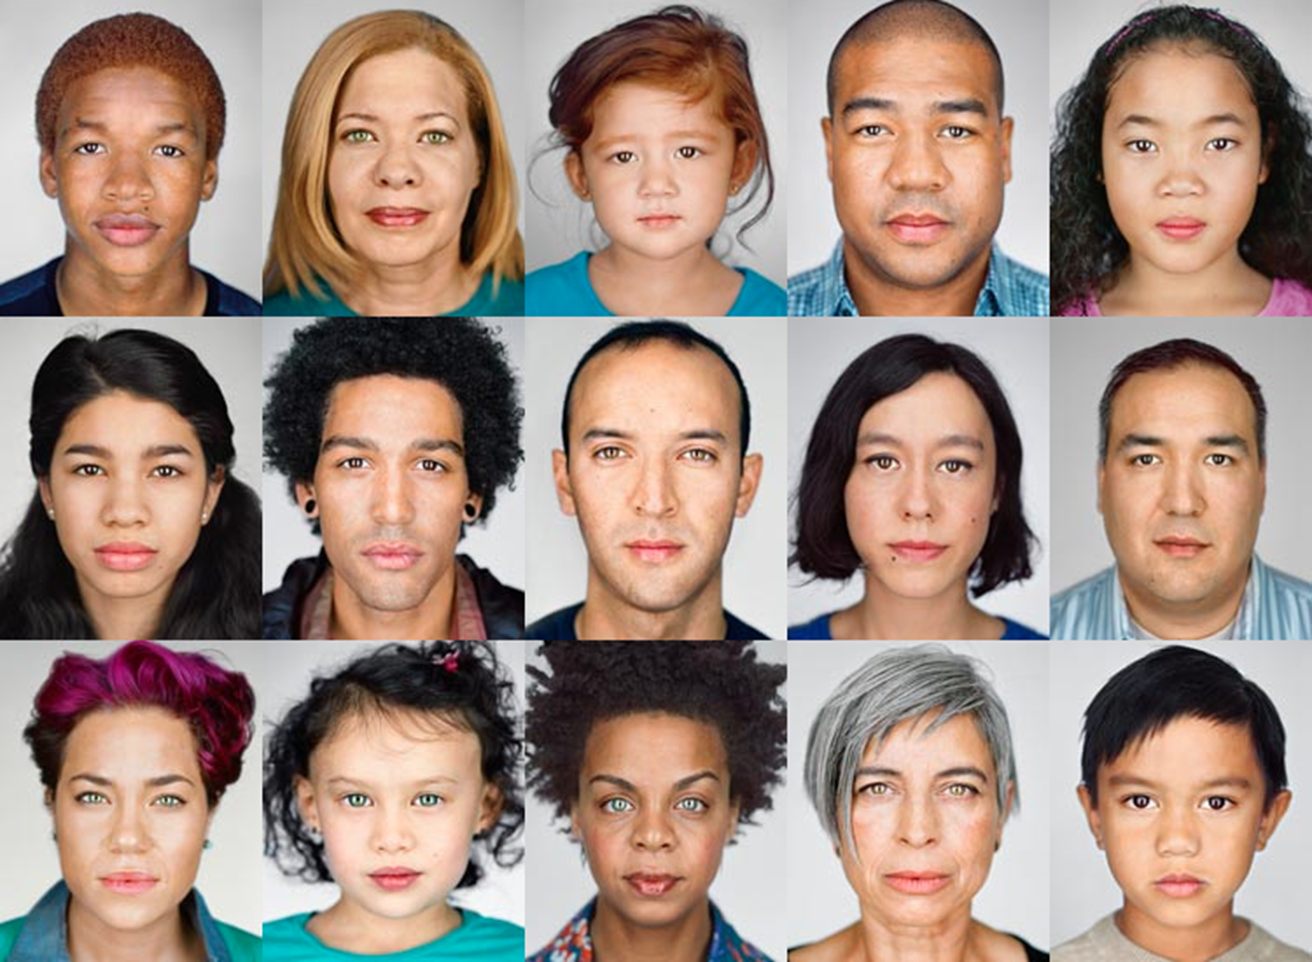
The New Face of America
The Changing Face of America Martin Schoeller, National Geographic Magazine
Growth in Population
24.9% Growth Population (2016-2060) Almost 40% of the U.S. are diverse Americans.
Source: U.S. Census Bureau & The Nielsen Company
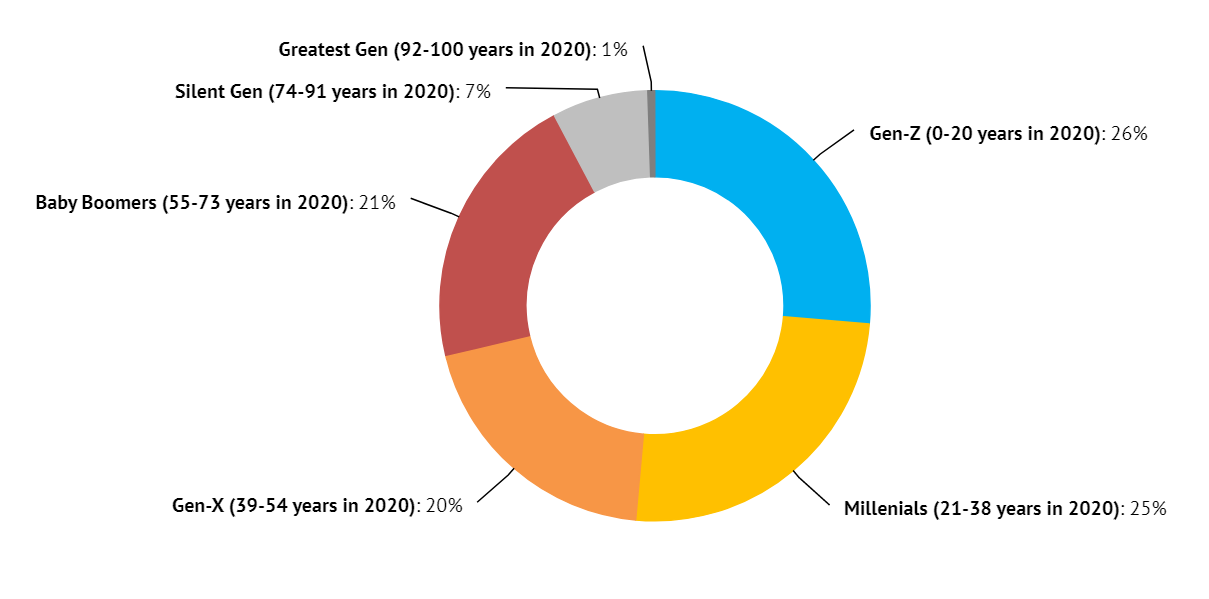
Generation Z and Millennials now make up more than half of the U.S. generational composition
U.S. Population by Generation. Source: Knoema
Millennials are projected to be the United
States’ largest living adult generation.
Gen Z—the first generation of true digital natives and are leading an evolution in shopping.
Gen Z is the most ethnically and racially diverse generation in history.
$3.2 Trillion Buying Power (2018) among multicultural consumers. As America grows more diverse, minority groups are becoming the “Super Consumers”.
CulturalData Analysis
Customer and culturalbehavior analysis is about understanding how your customers act and interact with your products what influences their actions so you can talk to the right audience, through the right channel, with the right message, at the right time.
- Uncover Actionable Insights: Informs decisions, focus on customer experience
- Track Trends: Monitor real-time trending topics linked to your brand industry
- Identify Opportunities: Anticipate problems, adjust your strategy, identify partners
“Without data you’re just another person with an opinion” E. Deming
About OYE
OYE! Mission
Buildknowledge of diverse audiences
Understand consumer behavior
Educate, inform andempower
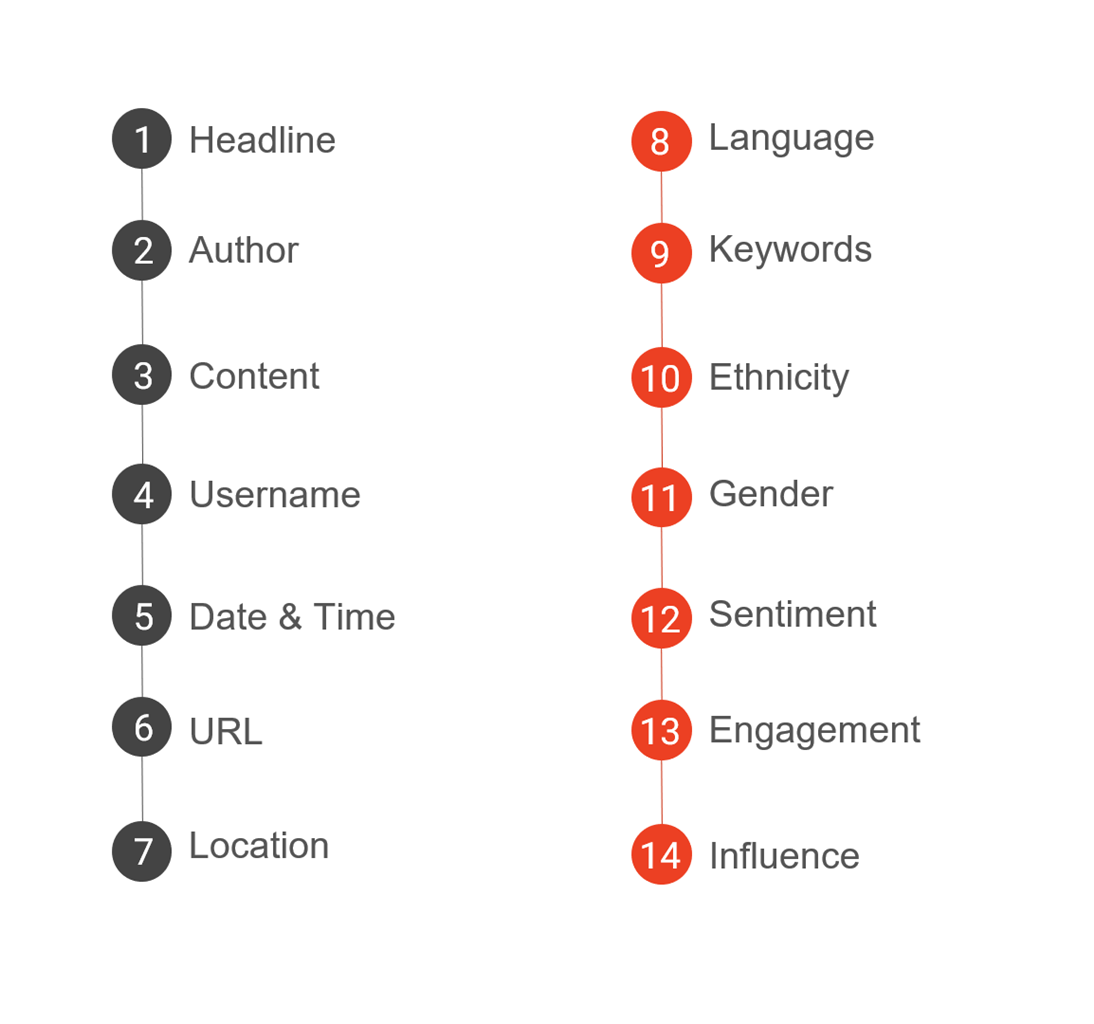
Data Enrichment
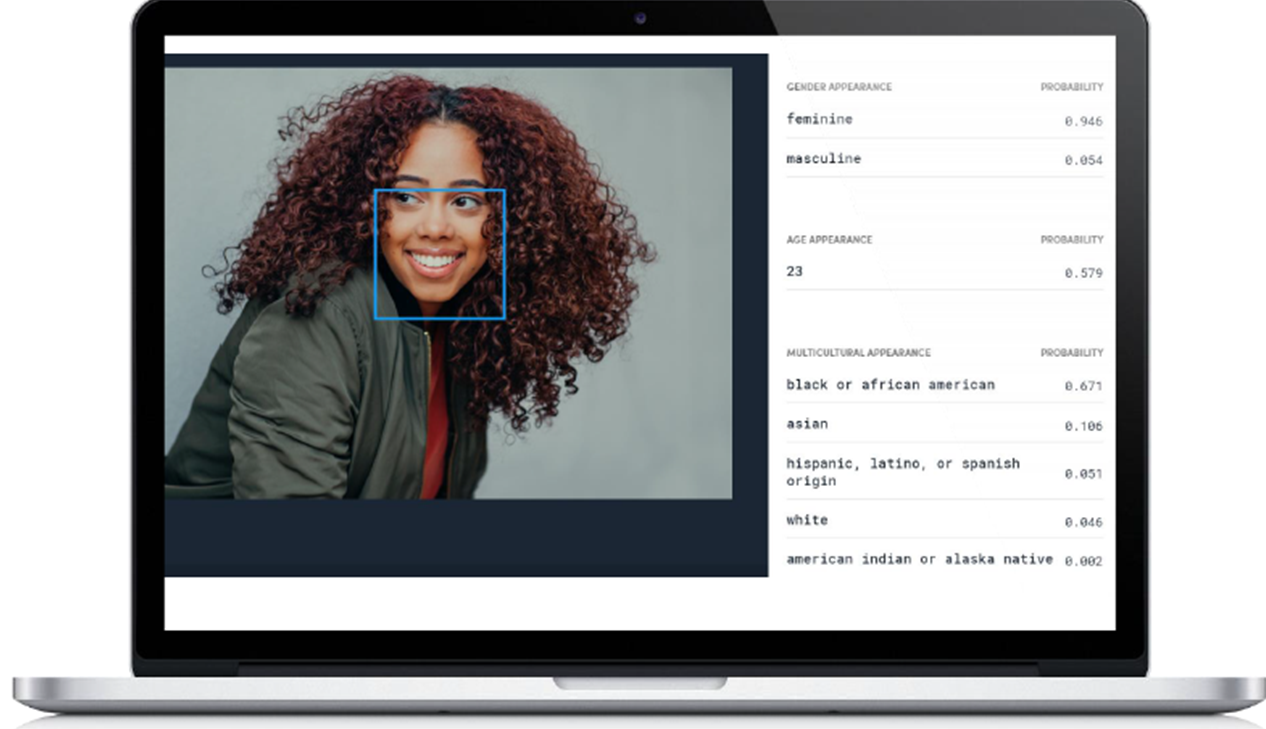
Visual Recognition
Ethnicity & Age
From Consumer To Creator
Online Influencers & Micro-Influencers: Brand awareness among true consumers
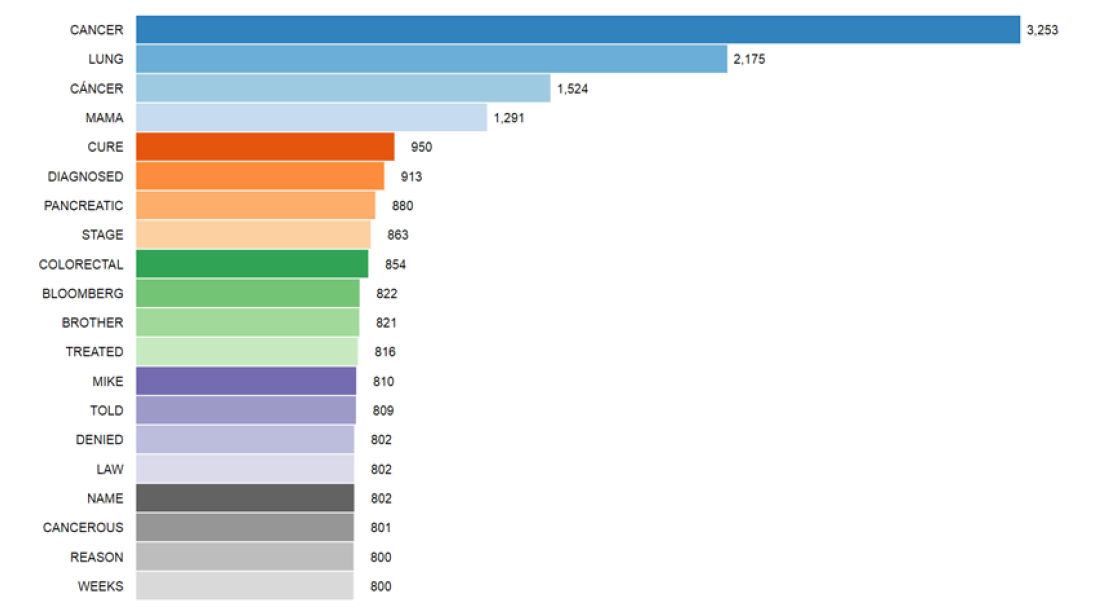
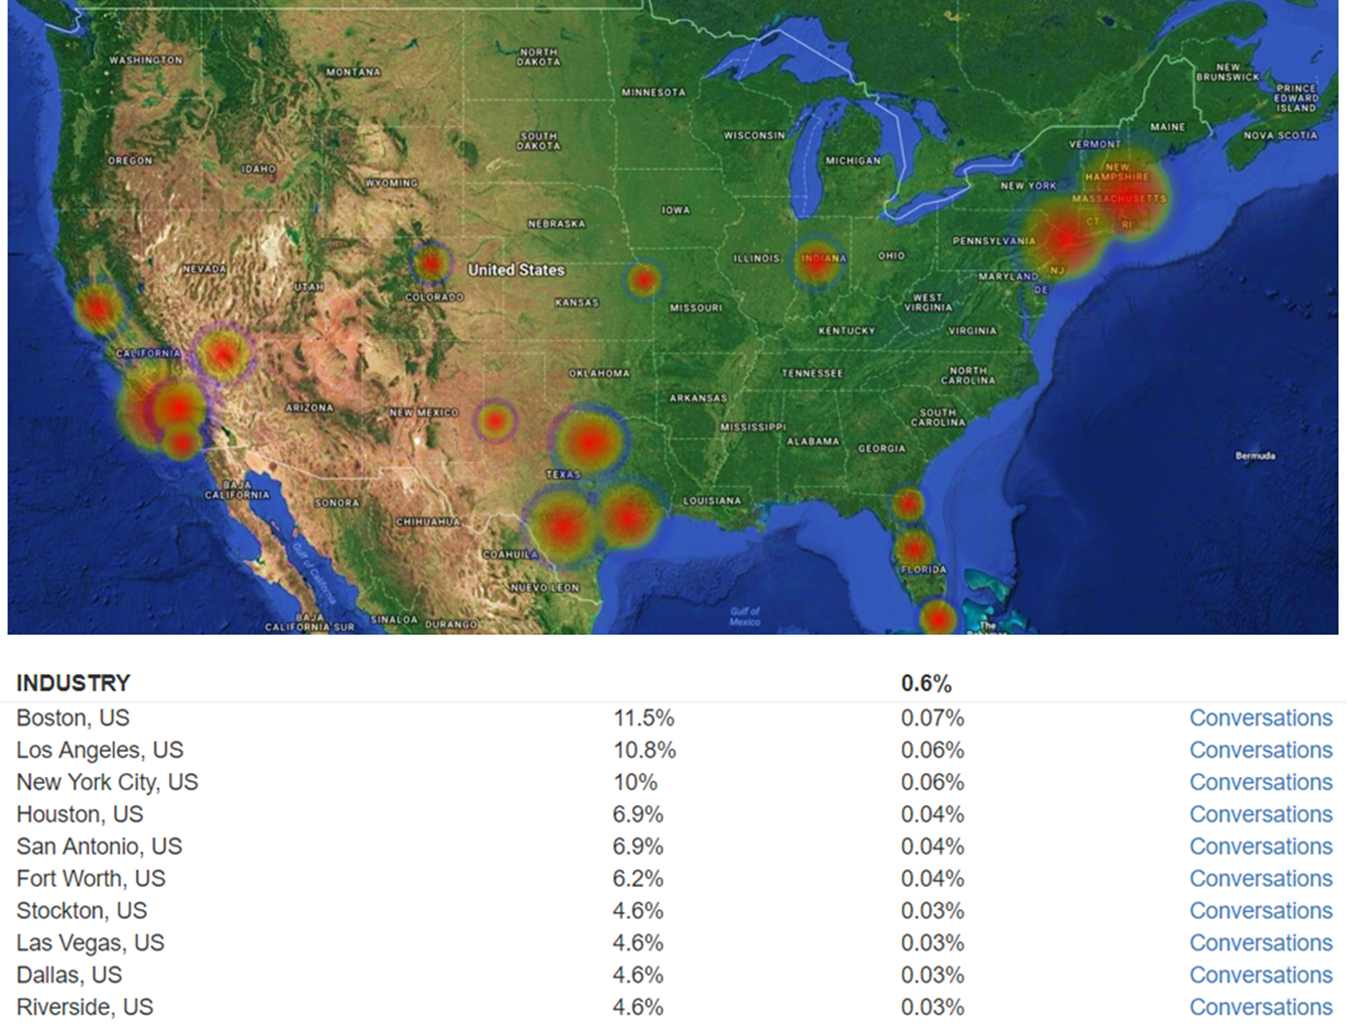
Real-time data analysis can capture top and less obvious keywords and hashtags that [micro]influencers are using on social media.
Each case will focus on discussions about business opportunities, approach (use of technology) and potential results.
For each case, students will describe how they will use unstructured and structured data sources.
Unstructured data sources: social media, mobile, blogs, public comments (articles, news)
Structured data sources: consumer comments, work orders, physician notes, etc.
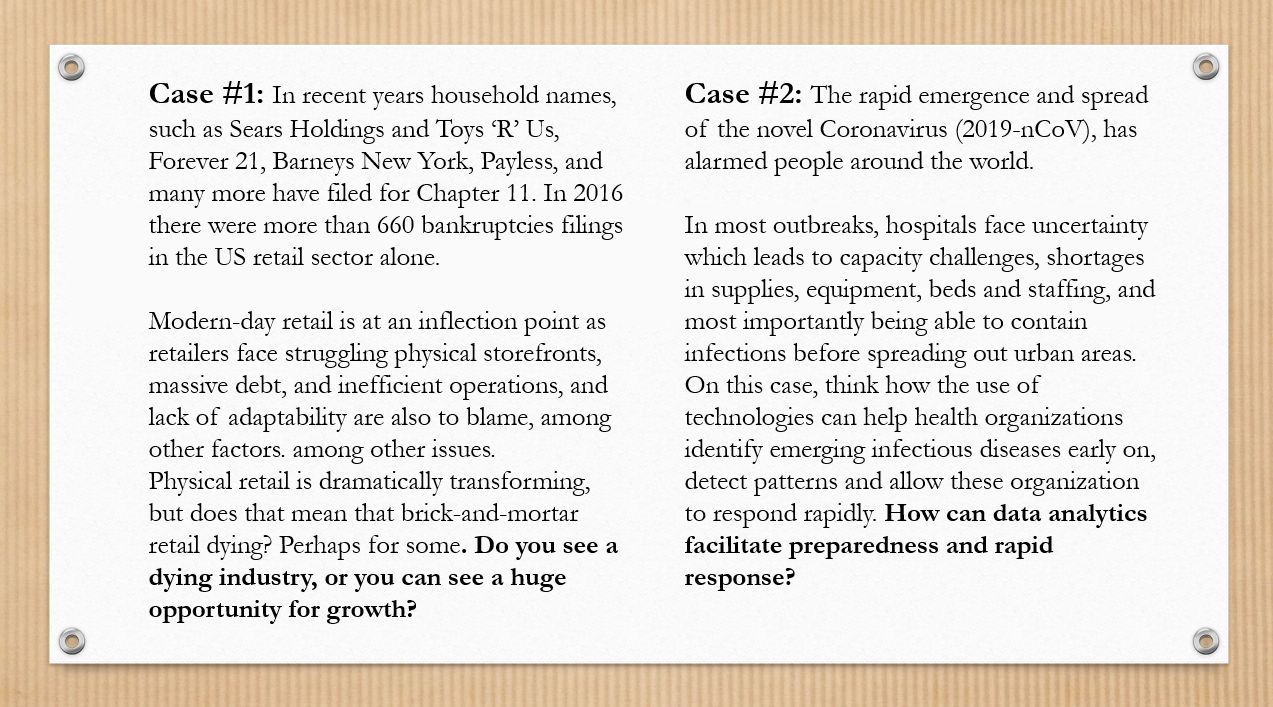
Case #1 Retail: Is brick-and-mortar retail dying? How data analytics can help (select a brand that you think is in crisis) gain market space. What would you want to know or do if you could get all internal structured data plus unstructured data?
Case #2 Healthcare: Coronavirus outbreak. How can real-time and historical data analysis support global health priorities and protect communities?